프로메테우스 공식 레퍼런스를 한글로 번역한 문서입니다.
전체 목차는 여기에 있습니다.
프로메테우스 노드 익스포터는 하드웨어나 커널에 관련된 다양한 메트릭을 노출해준다.
이 가이드에서 실습하는 것들:
localhost에서 노드 익스포터를 기동한다- 위에서 실행한 노드 익스포터에서 메트릭을 스크랩하도록 설정한 프로메테우스 인스턴스를
localhost에서 기동한다
참고: 프로메테우스 노드 익스포터는 *nix 시스템 전용 익스포터지만, Windows에서도 유사한 용도로 사용할 수 있는 Windows 익스포터가 있다.
목차
- Installing and running the Node Exporter
- Node Exporter metrics
- Configuring your Prometheus instances
- Exploring Node Exporter metrics through the Prometheus expression browser
Installing and running the Node Exporter
프로메테우스 노드 익스포터는 tarball을 통해 설치할 수 있는 하나의 스태틱 바이너리 파일이다. 프로메테우스 다운로드 페이지에서 다운받은 다음, 압축을 풀고 실행해라:
wget https://github.com/prometheus/node_exporter/releases/download/v*/node_exporter-*.*-amd64.tar.gz
tar xvfz node_exporter-*.*-amd64.tar.gz
cd node_exporter-*.*-amd64
./node_exporter
아래와 유사한 로그가 출력되는 것을 볼 수 있을 거다. 아래 로그에선 노드 익스포터가 현재 실행 중이며 9100 포트에서 메트릭을 노출하고 있음을 보여준다:
INFO[0000] Starting node_exporter (version=0.16.0, branch=HEAD, revision=d42bd70f4363dced6b77d8fc311ea57b63387e4f)  source="node_exporter.go:82"
INFO[0000] Build context (go=go1.9.6, user=root@a67a9bc13a69, date=20180515-15:53:28)  source="node_exporter.go:83"
INFO[0000] Enabled collectors:                           source="node_exporter.go:90"
INFO[0000]  - boottime                                   source="node_exporter.go:97"
...
INFO[0000] Listening on :9100                            source="node_exporter.go:111"
Node Exporter metrics
노드 익스포터를 설치하고 실행했다면, /metrics 엔드포인트에 cURL 요청을 보내 실제로 메트릭을 익스포트하고 있는지 확인해볼 수 있다:
curl http://localhost:9100/metrics
다음과 같은 것들이 출력되는 것을 볼 수 있을 거다:
# HELP go_gc_duration_seconds A summary of the GC invocation durations.
# TYPE go_gc_duration_seconds summary
go_gc_duration_seconds{quantile="0"} 3.8996e-05
go_gc_duration_seconds{quantile="0.25"} 4.5926e-05
go_gc_duration_seconds{quantile="0.5"} 5.846e-05
# etc.
익스포터 세팅은 다 됐다! 이제 노드 익스포터에서 프로메테우스가 스크랩해갈 수 있는 메트릭들을 노출하고 있다. 더 아래쪽에서 출력되는 내용들을 보면 다양한 시스템 메트릭들이 포함돼있다 (node_ 프리픽스가 달린 메트릭들). 이 메트릭들을 조회해보려면 (HELP, TYPE 정보도 함께):
curl http://localhost:9100/metrics | grep "node_"
Configuring your Prometheus instances
노드 익스포터 메트릭에 접근하려면 로컬에서 실행하는 프로메테우스 인스턴스를 그에 맞게 설정해줘야 한다. 아래 있는 설정 파일 예제 prometheus.yml에선 프로메테우스 인스턴스에게 지정한 간격으로, localhost:9100을 통해 노드 익스포터를 스크랩하도록 지시하고 있다:
global:
  scrape_interval: 15s

scrape_configs:
- job_name: node
  static_configs:
  - targets: ['localhost:9100']
프로메테우스를 설치하려면, 사용할 플랫폼에 맞는 최신 릴리즈를 다운받고 압축을 해제해라:
wget https://github.com/prometheus/prometheus/releases/download/v*/prometheus-*.*-amd64.tar.gz
tar xvf prometheus-*.*-amd64.tar.gz
cd prometheus-*.*
프로메테우스를 설치했으면, --config.file 플래그로 위에서 만든 프로메테우스 설정을 가리켜서 기동시키면 된다:
./prometheus --config.file=./prometheus.yml
Exploring Node Exporter metrics through the Prometheus expression browser
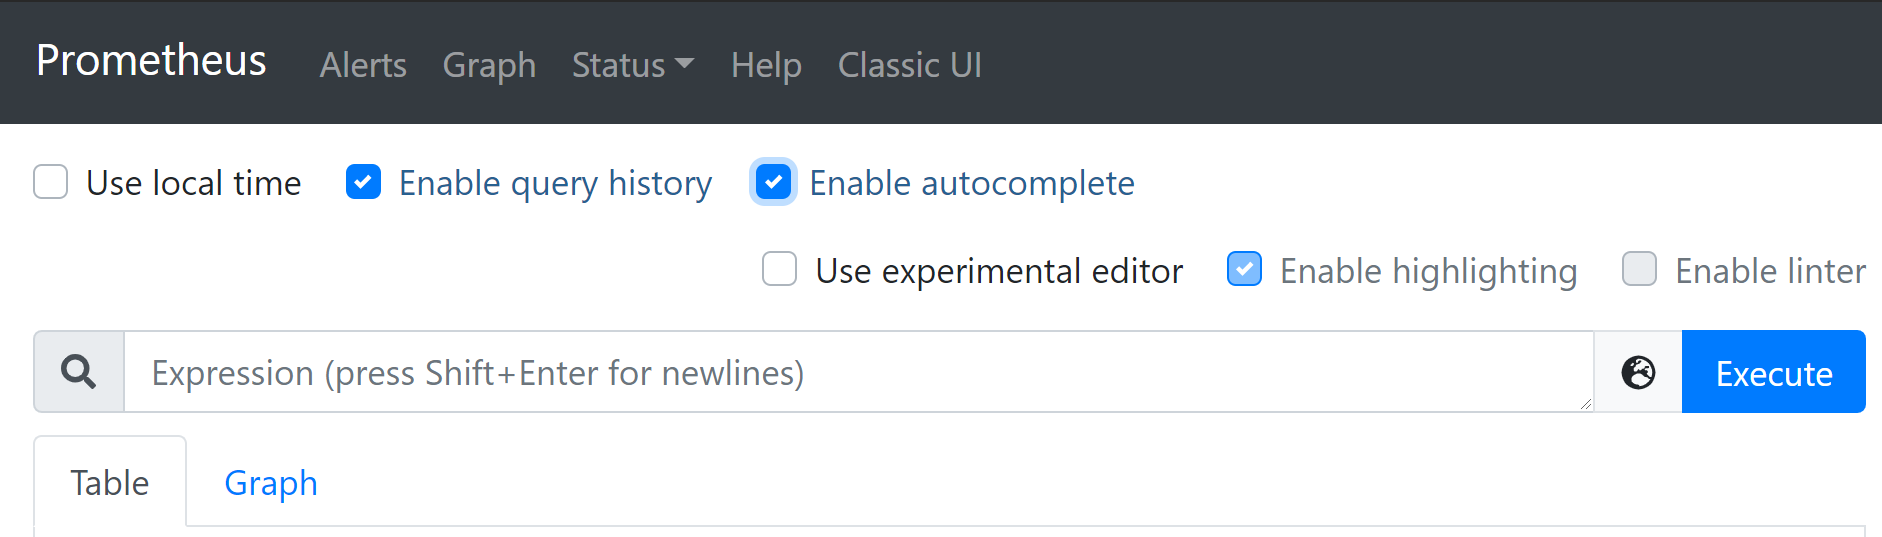
이제 프로메테우스는 실행 중인 노드 익스포터 인스턴스에서 메트릭을 스크랩하므로, 프로메테우스 UI(일명 expression 브라우저)를 이용해 관련 메트릭들을 분석해볼 수 있다. 브라우저에서 localhost:9090/graph로 이동하고, 페이지 상단에 있는 메인 표현식 입력창에 표현식을 입력해라. 표현식 입력창은 다음과 같이 생겼다:
노드 익스포터 전용 메트릭들에는 앞에 node_가 붙어있다. 예를 들면 node_cpu_seconds_total, node_exporter_build_info 등의 메트릭이 해당한다.
아래 링크를 클릭하면 몇 가지 메트릭들을 예시로 조회해볼 수 있다:
| Metric | Meaning |
|---|---|
rate(node_cpu_seconds_total{mode="system"}[1m]) |
지난 1분 간 시스템 모드에서 사용한 초당 평균 CPU 시간 (초 단위) |
node_filesystem_avail_bytes |
root 외의 user가 사용할 수 있는 파일 시스템 공간 (바이트 단위) |
rate(node_network_receive_bytes_total[1m]) |
지난 1분 간 수신한 초당 평균 네트워크 트래픽 (바이트 단위) |
Next : Securing Prometheus API and UI Endpoints using TLS Encryption
프로메테우스 인스턴스에 TLS 암호화 적용하기
전체 목차는 여기에 있습니다.